Total Pageviews

Sunday, May 29, 2011

The Myth of Dollar Cost Averaging?

Okay, there are times when one has to deliver bad news and this is one of them.  It’s a long believed and taught methodology that cost averaging into the stock market is a wise decision.  The reason this is thought to be true makes partial sense.  Say for instance that I have just won €100.000 Euro in the Lottery.  That’s about $140,000 dollars in U.S. currency in today’s exchange rates.  My financial advisor says, don’t invest it all at once but put €10.000 in the market each month for 10 months.  For American readers, in Europe they use commas where we use periods and vice versa for denoting numbers in powers of one thousand. 
Now, the reasoning of this strategy makes sense to most of us, because we are told, if you invest €10.000 each month into some company or mutual fund and the shares that month say are €1.000 you buy 10 shares.  Next month if the share price drops 10% to €900, you’d buy 11.11 shares (if you could buy partial shares like for a mutual fund instead of some stock).  Then if in the month after you invest €10.000 when the share price rose to say €1.100 you buy 9.09 shares and so on.  The net effect is that you’d be buying more shares when the price is lower and less shares when the price is higher so that on average you be getting the shares for less than the average price over the course of 10 months. 
Now, this is all true and of course you get the same result when using this example in dollars.  However, this only measures the average share price you obtained the stock/mutual fund for.  It does not measure the effect of total wealth based on the return the investment offers you, which to you as an investor is what you really care about.  Unfortunately, the net wealth obtained from this strategy is path dependent.  That is, the net wealth depends upon the history of the return over the investing period of your investment horizon, 10 months in this example. 
To prove this to myself I ran a half million Monte Carlo simulations for three distinct return strategies.  One where the average return over the 12 months was zero, one where it was biased toward slightly negative returns and one where it was biased to slightly higher returns over the period of investing.  A single simulation went like this.  I generated random returns over 250 days where each day could have a random return selected between -5% and 5% and everywhere in between.  For each 250 day period, I cost averaged 12 investments equally spaced of a single dollar.  I measured the cumulative return of this strategy.  I also invested $12 dollars all at once in the beginning of the 250 day period and measured its return.  I then compared the difference between the two strategies.  I did this for 500,000, 250 day periods. 
Then I did the identical experiment where the returns were randomly selected between -5.5% and 5%, to get a slightly negative overall return bias then again for returns selected randomly between -5% and 5.5% to obtain the slightly positive return bias.  I tabulated the returns and the time-series of returns and show the chart below documenting the results.  The average returns were  -0.25%, 0% and 0.25% across all half million returns, but the paths to obtain these average returns varied.
Now to help the reader understand these results, I draw your attention to the numbers highlighted in yellow in the chart below.  This is the mean and median return difference between cost averaging (DCA) and lump sum investing for each of the three sets of simulations.  Take the first experiment where we had a positive bias in the returns.  In this scenario, the difference is negative meaning that if you have a positive return over the investing horizon, you’d obtain $24 out of your original $12 investment and the dollar cost averaging would have offered only $18 on your investment (on average) over the time period of the investment horizon.  Hence, the difference is negative here and lump sum investing wins.


The next experiment in the middle of the chart shows that you’d have obtained about the same returns for each strategy (within numerical error).  Now look too the last chart where returns have a negative bias now.  Here, the cost averaging method wins because you would suffer less losses over time, keeping some of your investment in cash while markets are going down.  If you had invested the lump sum all at once in the beginning of the investment period here, you’d have more money subjected to negative returns and hence less wealth at the end of the investment horizon.
These numbers are unarguable about the path dependence of returns that determines whether cost averaging or lump sum investing is the better issue.  Of course when saving for retirement, one has no choice but to cost average into your retirement investment.  I haven’t met an employer yet who said on day one of employment, “here’s your 30 years salary in one lump sum payment”, so 401(k) is a savings plan everybody should avail oneself of regardless. 
These numbers hide the time-series of returns of course over the 500,000 simulations because we only show average values and its enlightening to examine those returns due to the breadth or dispersion of values around the mean numbers.  The chart below plots the 500,000 (truncated) individual simulation difference between 250 day, 12 investment cost averaging strategy versus lump sum investing, for the positive bias in blue, the negative bias in green and the zero return strategy in red.


From this chart, one can see the much wider standard deviation of the positive bias (blue) outcomes than the negative bias (green) outcomes.  This is very meaningful so let me explain.  If the return over the investing horizon is positive, this example demonstrates that the possible return of lump sum investing over the cost averaging strategy could roughly be between 4% to 8%.  While if the returns are negatively biased by the same amount the returns were positively biased, the spread between the cost averaging beating lump sum investing is only between 2% to 3%, a much lower dispersion.  Due to the effect of compounding of returns, the path dependency impact of which one is the better strategy favors lump sum investing over cost averaging. 
So in conclusion, this means the amount you’d better lump sum investing by when returns are negative by cost averaging, is much less than the amount you’d win by lump sum investing when returns are positive by the same amount.  Since no one knows the future returns over the next investing horizon, it could be positive or negative, however the odds are in your favor to lump sum invest rather than cost average the lottery winnings simply because the gains you’d attain lump sum investing are much larger than the gain you’d attain cost averaging if returns are positive rather than negative.

Friday, May 13, 2011

What does $3 Trillion Dollars Buy the Chinese?

Let us spend a moment putting the significance of a few numbers in perspective, as it’s always easier to gauge the magnitude of a number when viewed collectively.  Like people’s heights, when somebody 5’6” is standing next to somebody 6’5”, it’s easier to grasp their values in comparative stricture. 
To begin, no number needs more transparency than the U.S. debt level.  First for comparison, the U.S. GDP these days runs around ~$15 Trillion dollars.  That’s $15,000,000,000,000 per year that our economy produces.   The U.S. debt is also of similar magnitude but with a sign change (-$14.7 Trillion) making the debt to GDP ratio about ~100%.  It’s 140% for Greece and over that for Japan.  The difference is Japan’s debt is 90% owned by its own people, whereas the U.S. debt is half owned by Americans, the other half is owned outside the U.S.  Now, the current budget deficit of POTUS (President of the United States) is around $1 Trillion if there are no cuts (there will be).  Which means that if this budget is passed by congress, it would raise the U.S. debt by a trillion in a single year, to $15,700,000,000,000, assuming of course that the debt ceiling is raised to accommodate it.  This amounts to ~$52,333 per person, very roughly. 
Now, the U.S. runs a trade deficit every year.  We actually run a trade surplus in services, but it’s the goods we trade in that run a deficit, meaning we import more goods than we export, however we do export consulting, filling out paperwork and general business services for other countries more than we take in but by far and away, buy more goods.  This deficit runs to -$668,000,000,000 per year or about -4.5% of GDP.  China on the other hand has a GDP of about 1/3 of the U.S. of about $5,000,000,000,000 per year, with a trade surplus of +$169,000,000,000 which is about 3.4% of their GDP.  However, nonetheless, moreover and but……. China has a surplus of foreign exchange reserves of $3,000,000,000,000 ($3 Trillion) whereas the U.S. has…..well, debt.  This $3 Trillion in reserves is 60% of their GDP. 
Now, this Chinese surplus is invested in over a trillion of U.S. Treasuries, meaning we owe the Chinese $1,000,000,000,000 minimally, probably more.  They on the other hand, have no interest in our dollar falling (devaluing) as it has been, as they’re investment is losing money when that happens.  Nor do the Chinese want the U.S. to default for then as a creditor, they won’t get paid dollar for dollar either.  So given the fear of that happening, what might the Chinese invest these proceeds in to diversify away from U.S. treasuries? 
Well, for one the entire amount of commercial mortgages owed in the U.S. collectively, is $2.4 Trillion.  Meaning the Chinese could pay the entire amount of listed mortgages on commercial real estate in the U.S. take a huge ownership in buildings and land here, and STILL have $600,000,000,000 leftover.  Oh by the way, the 2008 to 2010 loss in total real estate in this country was $8 Trillion just to put things in perspective.  China could also pay off the entire debt of Spain, Ireland, Portugal and Greece and still have $1,500,000,000,000 leftover, a full have of their surplus.  In addition, using this half of their surplus, they could buy all outstanding shares of Apple, Microsoft, IBM, Google and Exxon. 
Or they could spend the whole $3 Trillion and buy Exxon, Apple, GE, Microsoft, IBM, Chevron, Berkshire Hathaway, Walmart, AT&T, Proctor & Gamble, Johnson & Johnson, Oracle, JPMorgan and Google.  They’d spend all their money then but considering that on January 1st, their surplus was $2.85 Trillion and by the end of March it was $3 Trillion, after buying all these companies, by the end of next month, they’d have another $15,000,000,000 in cash to do something with.  Oh by the way, if they bought all the companies in the Russell 2000 index of small cap stocks, all 2000 of them, they’d still have $1.4 Trillion dollars left over, or $1,400,000,000,000! 
All of Manhattan’s taxable real estate amounts to just shy of $300 Billion.  China could by the whole Island and have over $2.5 Trillion dollars left!  We could throw in all the property of Washington D.C. for another $232 Billion and make them overpay and they’d still own Manhatten and D.C. and have $2 Trillion leftover!!   Understand, the total Tornado and Flood damage we hear about in the media recently amounts to somewhere between $5,000,000,000 to $6,000,000,000.  This is only ~0.18% of the Chinese surplus.  Consider that it would only cost about $1.9 Trillion to purchase all of the farmland in the U.S.  The Chinese could buy all our productive farmland and still have $1,100,000,000,000 leftover.
Now imagine in you will, an alternate universe in which the U.S. had a trade surplus of 60% of our GDP like the Chinese?  A whopping $9 Trillion dollars instead of -$14.7 Trillion in debt!  Who of us, would be worried about social security, health insurance and medicare under that circumstance?   Food for thought!

Tuesday, May 10, 2011

Is the World Running out of Commodities, a Second Look?

Recently I read a very thorough analysis of long term commodity prices from one of my favorite strategists which prompted my thinking about natural resources.  I ask the question and seek to answer if we’ve entered a new paradigm when it comes to world natural resource use and distribution?   This basic premise has to do with population growth, the rise of China and India and their consumption of resources at a scale the world has never known, sitting on top of the developed world’s continued use of materials and resources.   

For instance, as of 2010 China’s share of global consumption was:

Cement                       53.2%
Iron Ore                      47.7%
Coal                             46.9%
Pork                             46.4%
Steel                            45.4%
Lead                            44.6%
Zinc                             41.3%
Aluminum                  40.6%

And the list goes on as the world’s second largest economy continues to grow unabated….. 

Using oil as a data-point, from 1878 until 1971 oil hovered about $16/barrel +/- a small amount in today’s dollars.  However, from 1971 to the present, it rose precipitously and today it is not only at record levels, but has moved 6 standard deviation above $16 in today’s dollar terms. Brent Crude closed at $117.52 just this afternoon.  With so many other commodities performing the same way, is this demonstrative of a paradigm shift in global natural resource supply and demand?  To put a nail in the coffin on this idea, since 1994, one has to dig up an extra 50% of ore to get the same tonne of copper and this 150% effort has to be done using energy at 2 to 4 times the former price.

I read Jim Roger’s book, “Investment Biker” in 1997.  He had finished a motorcycle ride around the world and much of that book is a mini-summary of global economics.  He was the first person I heard, talk about the coming commodity boom and his visits to many developing countries during this trip convinced him the world would soon be needing tremendous amounts of raw materials.  We are seeing this come to pass.

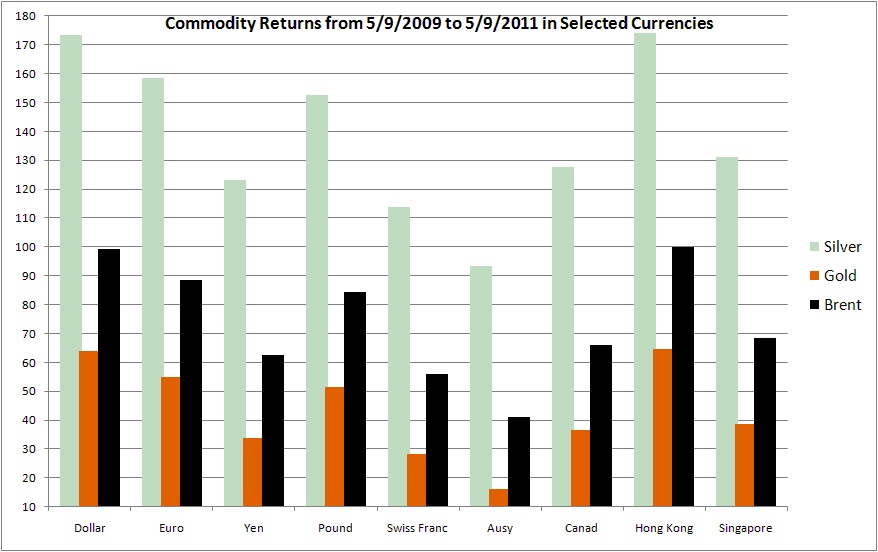
For the U.S., the purchasing power of the dollar continues to fall, especially relative to other currencies.  The following chart shows the return of Silver, Gold and Brent Crude from May of 2009 until now in various currencies.  Hong Kong currency represents the Yuan in this plot since the HKD is pegged to the dollar.  Notice however that measured in Swiss Francs, Australian and Canadian dollars, the appreciation of these three commodities hasn’t been nearly as severe as compared to what U.S. dollar consumers are paying (or earning on these commodity investments).  Is the fall of the dollar inviting demand for commodities as a hedge?


This run-up in prices hasn’t been missed and just before the credit crises of 2008 began, speculators took the media’s blame for the huge price increases even though the CFTC’s Interagency Task Force’s July 2008 Report on Crude Oil said:

The Task Force’s preliminary assessment is that current oil prices and the increase in oil prices between January 2003 and June 2008 are largely due to fundamental supply and demand factors. During this same period, activity on the crude oil futures market – as measured by the number of contracts outstanding, trading activity, and the number of traders – has increased significantly. While these increases broadly coincided with the run-up in crude oil prices, the Task Force’s preliminary analysis to date does not support the proposition that speculative activity has systematically driven changes in oil prices.

There have been other reports offering the same vindication that the fundamentals of supply and demand are changing such that price rises of commodities are due to shortages.  Currently corn stockpiles are at decade lows.  How can this have any other impact then that corn futures must rise, especially when growing middle class consumers in China, Indian, Vietnam and  Indonesia are hungering for more (historically) western styled foodstuffs?

The next chart documents commodity index price rises in energy, petroleum, industrial and precious metals, agriculture, livestock and softgoods.  Never before has the correlation across varying commodities been so high (i.e. all commodities moving lock-step in one direction, up!) other than during WWI and WWII’s when shortages abounded on a global scale.  Fortunately we’re not in a global war, but the cause is likely the same, global shortages of commodities.


Another point of reckoning has to do with the much larger availability of commodity ETF’s and mutual funds which are allowing the retail investor to participate in this asset class, where a decade ago, one had to buy physicals with ensuing storage problems or futures, both difficult for the retail market to handle.  In addition, the emergence of pension funds and institutional asset managers to make commodities part of their holdings too give’s credibility to the bull market in commodities as well as helps to keep prices higher by creating demand for the asset class.  Nevertheless, the demand whatever the cause means there’s more reason for commodities prices to continue to rise until this demand can be met.  The question I’m having a hard time answering is, will it?

Monday, May 2, 2011

Are the Days of Abundant Natural Resources Almost Over?


Recently I read a very thorough analysis of commodity prices from one of my favorite strategists, Jeremy Grantham of GMO.  In his April 2011 Quarterly Letter, he claims it’s time to wake up for the days of abundant resources and falling commodity prices are over forever.  In summary, Jeremy believes we’ve entered a new paradigm when it comes to world natural resources and in many ways it’s quite hard to argue.  His basic premise has to do with population growth, the rise of China and India and their consumption of resources at a scale the world has never known.   

For instance, as of 2010 China’s share of global consumption was:

Cement                        53.2%
Iron Ore                      47.7%
Coal                             46.9%
Pork                             46.4%
Steel                            45.4%
Lead                            44.6%
Zinc                             41.3%
Aluminum                    40.6%

And the list goes on…..He also analyzes oil and shows how from 1878 until 1971 oil hovered about $16/barrel +/- a small amount in today’s dollars.  However, from 1971 to the present, it rose precipitously and today it is not only at record levels, but has moved 6 standard deviation above $16 in today’s dollars.  This he concludes, along with many other commodities doing the same thing, is demonstrative of a paradigm shift in global natural resources supply and usage.  To put a nail in the coffin on this idea, he discusses copper where since 1994, one has to dig up an extra 50% of ore to get the same tonne of copper and this 150% effort has to be done using energy at 2 to 4 times the former price.

He then switches to discuss agriculture and talks about the easiest land masses for farming are already in use and that the planet has almost reached land capacity for agriculture use and that yield increases can only be accomplished due to more fertilizer and genetic engineering anymore.  Lastly, he discusses the ever optimistic American’s perspective that “we shall overcome” and why this isn’t going to solve our future problems.  Jeremy believes in sounding an alarm as to where things have gotten to and where they’re going.

I do believe he forgot several other important issues however.  Though the man has an excellent investment record and has been right many times before, the analysis of global supply and demand of materials and basic commodities is difficult to project.  It’s hard to nail these projections well for a single commodity let alone “all” commodities.  What he’s missing though isn’t good news unfortunately and only adds fuel to his fire.  It involves the debt to GDP ratios of most of the developed world.  He fails to mention it or talk about it much in this newsletter, but when you add this situation in the toxic stew, and throw in the fact that S&P recently issued a warning on U.S. treasury debt that it could be downgraded, you really get fearful. 

For all good reasons, the U.S. cannot grow very much for very long.  Therefore we can consider economic growth rates in the U.S. and Europe to stagnate at below 2% for some time, while the emerged economies of Asia continue to dominate growth and more and more account for greater percentages of world GDP.  Mr. Grantham’s last alarm is that even these economies of China, Brazil and India will have a stumble or two in the next few years and that in the longer future, beginning 2050 the depletion of natural resources will mean the globe will reach a level of mediocrity for our standard of living, implying we’ll all live at the mean.  I hope he’s not right.      

Wednesday, March 30, 2011

Where Should the Enterprising Investor Focus These Days?

In my book "Ben Graham Was a Quant; Raising the IQ of the Intelligent Investor" in Chapter 8, I state that if Ben Graham was an active investor today, his recipe for success would probably include some other pertinent factors we should include or consider in the wake of our current economy being dominated by financial companies and the service-based sector.  Similarly, in Chapter 6, I state that “empiricism suggests the main drivers of stock returns are often market trading forces more than underlying business financials, especially in down markets when fear is leading the investment decisions rather than fundamentals.” 

Well, what I believe is probably most important to add at this time is leverage or quality ratios.  The flight from leverage in 2008 was really extreme and you saw the bounce back in 09.  Most quant models in practice, especially when predicated on regression back-tests favor value and quality (not value or quality).  Hence most traditional value investor’s holdings typically are also of higher quality and they didn’t participate in the 09 performance rebound (as much) unless they were “value only” investors of which few are.  The “value and quality” paradigm exists because value factors are so intrinsically implemented in the most quant models directly but quality simply because of its correlation with out-performance.  That is, in the cross-section of returns, those that out-perform most through time are those that tend to get the capital structure most right and those not highly leveraged are found in the top fractiles.

Secondly, Credit Default Swaps came out in 1998 I believe, and capital structure arb player Hedge Funds’s started shortly thereafter.  That has meant a slow but steady increase in correlation between the corporate bond market and equities.  Thus, it seems to me that a prescient activity for fundamental equity investors should involve getting a better understanding of the underlying debt/asset ratios and look for value predicated on the intrinsic value of the equity.  Cutting on these factors may not identify buy candidates but they will identify candidate stocks to avoid.

Now in down markets when fear is leading the charge of influence of stock return, stocks disconnect from fundamentals.  Thus, buying low volatility (low g-Factor, low Beta) stocks when the VIX is increasing is a good strategy, as long as you sell them and buy high vol (high g-Factor, high Beta) stocks when the VIX is decreasing.  Thus, working with incorporating volatility into your strategy can pay dividends when minor ELE events are happening.  I believe in addition to paying attention to the corporate debt side of the equation, a lot can be garnered by studying the implied vol of a company’s option chain.  That gives the trader’s view of where the stock is going.

In terms of their weighting?   That’s difficult to say a bit unless one spends some time modeling the factors you uncover along these lines relevant to return.  Each investor must determine that for themselves.

Sunday, March 27, 2011

How Much Corporate Tax is Enough? NYTimes says GE pays too Little!

The New York Times recently ran an article (http://finance.yahoo.com/news/Here-How-General-Electric-GE-wscheats-2926862183.html?x=0), recently referred to on Yahoo Finance.  Some call it an expose on the lack of taxes General Electric (GE) paid.  In this article they claim GE is a “welfare recipient”.  However, what is lacking in these details is a fair and honest interpretation of the facts.  When you approach the business of corporate taxation from the prospective that corporations exist for the welfare of the state, and that any profits they make should somehow be available to the societies they live in, well then you may as well have the government take ownership and nationalize all public corporations.  This experiment has been done already and we called it communism.  When the New York Times comes down hard on the percentages of tax our S&P 500 companies should be paying, it’s almost communism they are espousing.  They conclude that somehow, whatever the tax, it’s just too low when these corporations are making billions and that the U.S. government has a right by fiat to confiscate a higher percentage of corporate profit.  As if they “owe” the government something, or like you and I owe the government something.  We don’t owe them anything, taxation isn’t covered in the constitution.  
Well, forgetting about the obvious “Chavez-Castro” behaviors these ideologies foster, it’s important to realize a couple of specifics.  First, major U.S. corporations employee hundreds and thousands of Americans.  What is the amount of taxes these employees pay on their hard earned income, before they leave earnings and profits to the company?  What if you add these amounts to the corporate contribution to our tax-roll, then how much are these companies paying to society as a whole?
Secondly, much of the complaint in the article from the NYTimes about GE, has much to do with re-patriating foreign earned income.  When GE or Exxon or Walmart or Google earns money overseas, do you think those governments do not tax these monies?  So, then the New York Times and its ilk, would bring those dollars back to the U.S. and re-tax them on the full amount of earnings, not on the amount leftover after foreign tax.  I for one, believe double taxation is evil and morally wrong.  It’s confiscation, not taxation. 
Let’s put this concept into perspective.  If you have a good business idea and form your own corporation exporting Arizona wines (a recent terroir found well for grape growing) to China, you might elect to have Chinese consumers pay you in dollars or perhaps maybe if it’s a small amount they’d pay you in Chinese Yuan.  Then, maybe you’d open a bank account in Hong Kong and keep a percentage of profits there, to cover some costs your business might incur in Yuan denominations, costs to distributors for instance.  You are thinking about expanding your business to Vietnam and maybe Singapore and are working on some deals with other distributors who you’re planning on paying in Yuan.  So, you leave that money there and each and every month add to it a bit with overseas profits while you’re making deals, and take some profits home to the U.S. also.  Eventually after some time, that small amount in the HK bank becomes equal to your year’s income back in the U.S. from the profits you did re-patriat.  Now, a NY liberal sees this money in your account, or hears about it from a cocktail party and reports you to the IRS and says, “ that’s unfair, they need to bring that money back to the U.S. and pay taxes on it”.  Meanwhile, you’ve had to file a Hong Kong tax report and pay taxes on those earnings as you’ve earned them all along.
This in simplicity is what we’re talking about in regard to foreign earned income.  Besides the fact, that corporate profits are not the U.S. government’s money, nor U.S. citizens money not counting the fact that major corporations are “citizens” of the world anyway, that money is destined for investment, somewhere, eventually and of course is taxed by those authorities in each country wherever it’s used.  To my knowledge, any person nor a corporation can escape taxation entirely, eventually it catch up with you, somewhere and for the S&P 500, they can’t hide, they’re just too big. 
So, using FactSet software and Standard & Poors data, I downloaded the S&P 500 taxes, income, pre-tax and EBIT numbers and formed the ratio of taxes paid to these other parameters.  Here’s how the top 25 largest corporations in the U.S. fair.


As you can see from this data, GE is number 6 on the list, it paid 7.4% of pre-tax income in taxes.  But look at the other companies.  Are their taxes to low?  Would you like to see all these numbers closer to 60% or higher?  If so, then you can expect the U.S. economy to run much slower than it is now and unemployment to run much higher.   You cannot expect to have growth, to have corporations create jobs when a significant percentage of profits go to tax.  These numbers are pretty disparate, but indeed some are fairly large.  Are Exxon and Chevron’s contributions of over 40% of pre-tax income high enough?  The numbers below are the averages across the S&P 500 over 2010.


This tells me that 24.3% of pre-tax income is paid by the S&P500 on average per corporation.  That’s a good number.   Yes GE is low on the list, but this has much to do with claiming tax credits due to many technologies that the government is incenting due to their “green” nature along with the foreign profit impact.  Now, if you’re “green” and have been crying for corporations to “go green”, since green is generally more costly than not, you need to provide incentives for them to do so.  For instance, years ago I owned a small “farmette” that included 13.6 acres.  Given this room, I looked into building a windmill and battery bank to provide my own electricity.  The out-of-pocket costs were $20,000, while my monthly electric bill at the time was $54.  Do the math.  My return on investment would have been taken 20 years.  Why would I do this?  This was in “cloudy” upstate New York and though on my mountain top there was plenty of wind, there were no tax credits for windmills, only solar so again, why would I or anyone make this investment?  Now you’d ask then, why is it different for a major corporation?  Why should they switch to green technologies that are more costly without incentives (i.e. tax credits)?  So goes it with GE.  Whirlpool for instance also hasn’t’ paid much tax (its number 395 on the list, not shown) and has paid -10% as ratio of tax to pre-tax income.  Why?  Because of the tax credits they get for making “Energy Star” appliances.  So when environmentalists all go out and buy “low wattage, energy efficient” refrigerators, furnaces and dishwashers, they can thank their U.S. government for subsidizing their manufacture and of course, these incentives for corporations to go “green” both in terms of what they manufacture and use. 
In general, there are many people in this country who generally, are more socialist in their thinking, and more “European” like in their policies, and would have the U.S. move toward the European model in the relationship between the corporations and government.  If you are one of those people, understand there is no “free tax”.  The more you take from corporations (and individuals) the stronger the ramifications to growth in the economy will be.  There is no way around this.  Company’s need money to invest and when the government confiscates it in higher taxes, there will be net less investment, less job growth and it will create an incentive for these very large companies to do business elsewhere.  The result will just be to allow the emerged market countries to close ranks with us sooner and we’ll lose business and wealth to them just faster.

Friday, March 25, 2011

Inflation? Ben says no, General Mills and Warren Buffett say Yes!

Recently, I had the opportunity to hear economist Ken Rogoff, author of “This Time is Different” along with Ian Bremmer of Eurasia group and author of “The J Curve” speak.  I even exchanged books with Ken and gave Ian one of my own.  Though these guys have very different styles, what was important to realize is that both men are NOT optimistic about the future of the developed world’s economies.  For instance, recently we read in the WSJ that Portugal estimates they need $99 billion (U.S. equivalent) to keep from defaulting, while simultaneously their prime minister failed to get a key austerity budget passed.  It appears the Portuguese politicians really are ignorant of their situation.  The continued cries from Greece public employee unions to avoid budget cuts at all costs also shows the severity of the misunderstanding the populace about the situation in Greece and Portugal, two of the PIIGS states.   You have to be mindful that “bailing” out the Eurozone can only be a drag on the world’s largest market (yes the Eurozone is larger than the U.S.) and France is willing to spend as much of the German GDP as possible to quiet the countries of the PIIGS fall. 
Meanwhile, at home the U.S. Treasury led by “banana Ben” refuses to acknowledge the cost increases of most commodities, major goods, oil and that inflation is not a threat, but is already here.   A nail in this coffin is a quote from Ken Powell CEO of General Mills, makers of my favorite cereal Cheerios, where he says, “we don’t pass on pricing anywhere near the full level of inflation” but General Mills are raising prices and state expectations of rising costs of grains to be between 4% to 5% by 2012.  How long can we put off the costs of foodstuffs, when grains, sugar, corn, soybean, wheat and other commodities are rising like hot air balloons besides oil, and not call it inflation!  Oh by the way, General Mills did have 3rd qtr earnings rise by 18% due to global demand, not U.S. demand.  Kudos for the Emerged Markets!
It’s not without trepidation we invest in the U.S. and Europe these days (unless we see mis-pricing anomalies like in 2008).  The inflation threat is real.  Bill Gross is avoiding U.S. treasuries because he sees yields only rising due to inflation while Warren Buffet has recently stated, “I would recommend against buying long-term fixed-dollar investments,” Buffett, chairman and chief executive officer of Berkshire Hathaway Inc. (BRK/A), said today in New Delhi. “If you ask me if the U.S. dollar is going to hold its purchasing power fully at the level of 2011, 5 years, 10 years or 20 years from now, I would tell you it will not.”
Other highly rated practitioners offer similar views.  The U.S. dollar is a short in the long run.  Be prepared.

Tuesday, March 15, 2011

Investing in Japan in Support of Their Economy!

There is an expression among professional investors that says, “Buy on the dips”.  It comes about because investor behavior is such, that we over-estimate the impact of horrific events and under-estimate good news often.  This behavior is also linked to anchoring where the most recent events weigh most heavily in our minds.  Unfortunately, what has happened in Japan is a terrible tragedy.  Having some business acquaintances there, the first thing I did when I heard about the earthquake last Friday is email them inquiring about they and their family’s safety. Fortunately, they are okay.  However, that does not mean we cannot find reason to invest in Japan provided we keep a careful eye on events there.
Warren Buffet’s teacher Ben Graham’s focus is often about best practices and saving us from ourselves.  That certainly is what his book “The Intelligent Investor” is about, being patient, disciplined and teachable and that those qualities will allow for gains in the market even above those with extensive knowledge or experience in finance, accounting and stock market anecdotes that do not practice those virtues.  For instance, a portfolio manager I worked with, who at the height of the sell-off in February of 2009, before the correction took place stated the obvious, that stocks are being priced for bankruptcy, though many of them have earnings and no debt!  “Certainly even those with some debt have fallen far enough to be worth something!” he said.  He bought many of these stocks.  Ruby Tuesdays for instance was trading between $6 to $7 a share prior to September of 2008 for a while, than between October 2008 to March 6, 2009, it fell to $0.95 cents a share.  At this point, it was priced to go out of business but subsequently by April 9, it was trading for $6.61 a share again.  Graham said, “99 out of 100 issues at some price are cheap enough to buy and at some other price they would be so dear that they should be sold” and he wanted to embed in the reader a tendency to measure and quantify (which is exactly what any quant would argue for). So in the ensuing example of Ruby Tuesday (ticker: RT), the advice we garner from Graham, is that one should stick with stocks selling for low multiples of their net tangible assets to purchase.  But we also learn, that when the market drastically turns fearful and a sell-off occurs, it’s usually overreacting.
 
In the data that follows below for instance, we show the calculation of the current ratio for Ruby Tuesday during the melee of its share price falling to $0.95 per share.  The data shows that total assets per share stayed pretty even from May 2008 right through to May of 2009 and that the net tangible assets (Equity per Share) were about one times the share price (right scale of price graph, trading volume is left scale).  The current ratio is below Graham’s ratio of two, so it would not have passed a “Graham” screen, but when the stock traded below net assets, essentially anytime below $6 share, the stock was a buy, and when it dropped to $0.95, with a price to tangible book value of 0.20, the stock was a steal!   What an opportunity!  The market mis-priced average companies during the credit crisis as though they were overwhelmed with debt (like Ruby Tuesday) and it presented a great buying opportunity.


The ultimate result of this kind of investment strategy is one of conservation of principle but indeed has better outcomes over the long term than chasing glamorous stocks in the growth style, where forecasting future earnings is distant and vacuous as compared to measuring something as simple as net asset values.  Thus, Graham’s odyssey is really about true value discovery, about separating what the current market price says about a stock versus its real underlying intrinsic value

Now back to Japan; when you hear of reactor meltdowns, breach of containment and over-estimates of the death toll, this means that most investors and “Mr. Market” are probably going to over-estimate the future impact of these tragic events.  That’s the time to buy a Japanese Index fund or ETF.  Or, if you have the stomach for it, buy some Toyota or Honda.  These strategies will pay you dividends going forward.  You be telling the Japanese people that you are in support of them besides.  Albeit, wait a week or so for a bit (but not all) uncertainty to subside.

Friday, March 11, 2011

Chinese Slave Labor?

From time to time people say to me, aren’t you concerned about the Chinese exploiting the factory laborers like they are, paying them “slave” wages?  Now, in all honesty, most of these off-hand remarks are from Americans whose worldviews and experiences are U.S. centric simply due to their home bias.  However, it’s time to put some information together to reveal how unaware these comments are of the true situation in the Far East.

To begin, inflation is quite rampant in China, India, Singapore, Thailand, Vietnam, South Korea, Malaysia, Hong Kong, Indonesia and many other emerging markets.  Food prices, not to mention oil prices are having a huge impact on these parts of the world and as most of you know, these are crowded countries so there’s not much more land available for farming.  So, this results in inflation in these countries across most goods and services. Inflation is not only coming from the demand side, but also from the supply side for food and other commodities, not to mention oil.  The chart below from the IMF puts these numbers in perspective.  There’s no doubt prices across the globe are spiraling.
In particular unemployment is below 4% for Malaysia, Thailand, Singapore, Hong Kong and South Korea.  Industrial capacity is also above historical averages for these nations so that by most standards of economic measures, Asia is back to where it was before the global credit crisis hit in 2008.  So what will these nations do to combat inflation and what is the impact on these country’s economies due to these consumer price rises?

Well, to begin, fallout from rising prices puts pressure on businesses.  Given these low unemployment rates in the Far East, there are labor shortages beginning to occur.  Finding employees is becoming difficult and second, even if unemployment wasn’t low, rising prices means wages need to rise to subvert social unrest, an obvious issue for the Chinese for instance.  Singapore has a long history of immigrant labor and the shortage these days means that employees can switch jobs and get 20% to 30% raises just for the taking a new position.  The World Bank says Thailand raised the minimum wage 6% last year alone and is claiming labor shortages of over 100,000 for workers.  The same thing is occurring in Malaysia.  In China we’ve seen strikes and work stoppages because employees are demanding wage increases and the good news is, they’re getting them. 

The chart below breaks out inflation in the G7 developed world, developing Asia (ex-Japan) and the ASEAN-5 consisting of Indonesia, Malaysia, Philippines, Singapore and Thailand.  There’s no doubt this is making labor disgruntled and forcing wages higher.

The usual prerogative falls on the central banks and they will (and are) raising interest rates to try to choke-off the rising prices but generally, these rising prices are destructive and are straining industrial capacity and labor.  It’s making it very good for job hunters and many native born Chinese and Indians studying abroad for instance are going back home rather than staying in their host country after graduation like they have in times past.  Moreover, much of the immigrant labor from countries like Bangladesh and Indonesia that offer supply, are finding more opportunities at home.  So demand for labor is increasing while supply is falling leaving wage increases happening in order to in order to close the gap.

Unfortunately, these rising prices across global commodities combined with the developed Western world’s central banks quantitative easing as it’s called, which means printing currency effectively, is eroding the West’s standard of living and in fact debasing the currencies of these countries.  In fact the next chart illustrates this by showing the major stock indexes of the world priced not in their underlying currency, but in the currency of the commodity basket of the Reuters-CRB index prices. 

The Reuters Commodity Index is made up 19 global commodities, many of which are rising rapidly.  Thus, the chart below signifies that the currencies of the world are really falling relative to commodities and thus purchasing power is falling in Dollar, British Pounds, HKD, Yuan, Yen and Euro.
One of the considerations the governments in the developed world (U.S. Eurozone and Japan) have is how to pay the interest on their burgeoning debt.  One way, is to print money in so doing, devaluing the major currencies of the world relative to oil and gold and other commodities.  This is evident when you describe the stock market indexes in terms of underlying commodities prices versus fiat currencies.

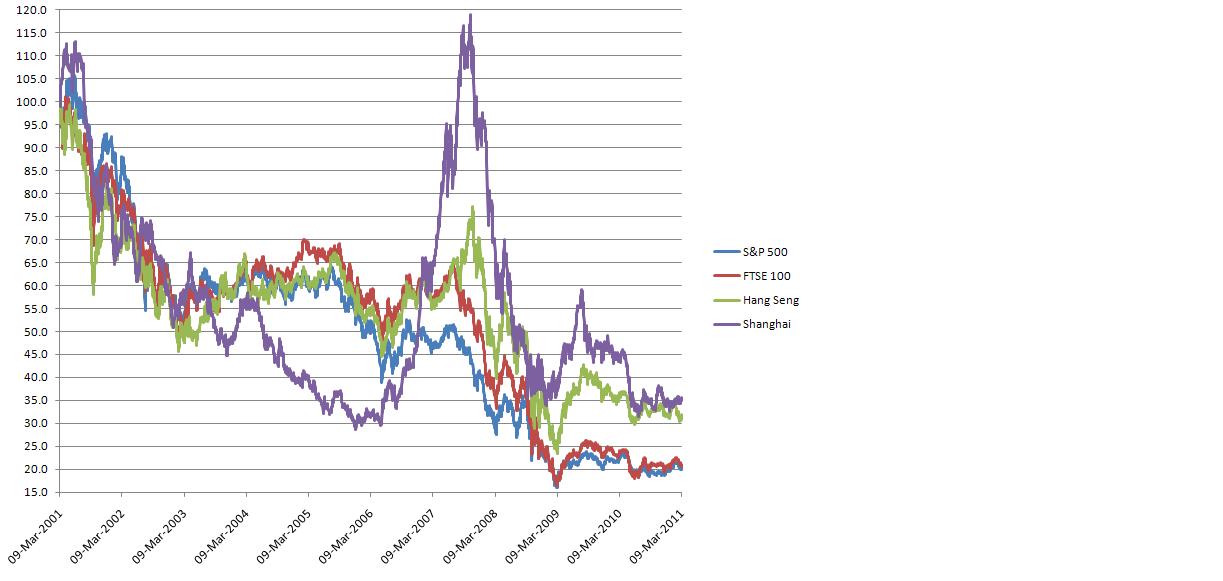
The chart below prices the indexes over the last decade in Gold.  The run-up in Gold prices in essence is associated with the loss of confidence in fiat currencies.  It’s not just commodity demand that is causing prices of commodities to rise, but also this loss in trust of major developed world currencies due to the size of most developed world debt.

This chart above shows the last decade of the S&P500, FTSE 100, Hang Seng and Shanghai stock indexes, priced in Gold rather than U.S. dollars, British pounds, Hong Kong and Chinese currency respectively.  The HK and Chinese currencies are pegged to the U.S. for the most part, but lately the Chinese Yuan has been rising slowly relative to the dollar.  The data here is also normalized so that all indexes fit on the same scale, but this does not affect their trends which is collectively downward.  The Shanghai stock market bubble is quite evident at the height of the global credit crisis in 2008 however, but the main trend is clear, relative to gold, the earnings power of currencies is decaying.  In spite of the dollar’s short term gains against other currencies recently (not shown), the global purchasing power of currencies is falling.  Only the Australian and Canadian dollars are holding there own these days, and that can be tied to their huge natural resource exporting economies (i.e. commodities). 

The next chart shows the same data for the Reuters Commodity Index, the Nikkei 225 (Japan), CAC 40 (France) and DAX (Germany) priced in Gold rather than U.S. dollars, Yen, and Euros respectively.  Even here, relative to gold, the basket of commodities (R-CRB index) has even fallen, though not as much as the indexes.
The takeaway from these plots is like we’ve said before, fiat currencies are losing their value relative to materials and commodities.  The buying power of currencies is dropping worldwide.  This occurs along with the natural rise in inflation in the Far East due to the huge and growing demand for consumer goods and Western style food as these economies arrive into developed nation status.  Moreover, it puts pressure on wages in these countries and allows for job growth to spur considerably faster than in the developed world, which will have a long and possibly unresolved economic hangover due to the very large government debts these nations are running and not dealing with in a truly effective manner.

My investing advice is to buy hard assets and don’t keep money in currencies or government debt, but in instruments that have the potential to appreciate at least as fast as the Commodities indexes, many of which are available today to the average investor as ETF’s.

Saturday, March 5, 2011

What's this World Coming To?

First of all, having traveled quite extensively in Asia over the last couple of years, I can assure you, there is no Chinese 10 year old working for a nickel.  The Chinese are quite happy about their rise in the world and the job's they have. For our economy's situation, the question isn't whose to blame, but if blame has to go around, yes it's the policiticans mostly.  But the unions are second or maybe third.   In general, the collective policitians (both sides) at state and federal level don't understand economics and neither do the unions.  However, none of it really matters because this is what's going to happen. The global situation has arisen so fast, politicians have been caught completely unaware of the competitive environment everywhere and the US just will no longer be competitive due to the welfare state we've created.  Union pensions are just part of it (but they are a considerable part of it). 

For example, in Portugal, Ireland, Italy, Greece and Spain (the PIIGS) what happened is govt payrolls grew so that 25% to 30% of the workforce were govt employees.  The US is currently at 20%.  In this last recession, the unemployment went to the private sector.  Govt payrolls did not decrease nor did govt employee retirement benefits and pay.  Essentially govt workers haven't experieced the recession like the private sector and on top of that the number of people employed by the govt grew.  This is well documented and the WSJ published the data recently.  This is the truth and has nothing to do with one person there or one person here you personally know who may have lost a govt job.  In the private sector it's much worse!  
So, just like in Paris now with labor strikes, Athens, Madrid (Spain's unemployment is over 20%!!)  and these other European welfare states, they are having to go through great pains to have cuts in govt payrolls and benefits.  There is no other way.  There is no more money.  Moreover the larger picture involves right now where the US debt is almost $15 trillion dollars.  The US GDP is also ~$15 trillion.  That means our debt to GDP is 100%.  In Greece it was %129, Spain %100.. essentially the US is just like these countries.  The saving grace is that we can print our own currency. Those countries cannot print the Euro.  Very soon, the US currency will lose it's reserve status because we keep printing and the growing clout of other nations.  When that happens, the Chinese and Asia will stop buying US treasuries.  
 
A side note, when we purchase goods made from China (and btw, if we didn't our standard of living would be way lower than it is now, because the cost of producing goods here would mean they'd cost 3 x what we pay for them at Walmart) in dollars, the Chinese govt buys those dollars from Chinese companies with Yuan and than takes those USdollars to buy US treasuries.  They own $1.8 trillion of our $15 trillion in outstanding debt currently.
 
When China and Asia stop bying our debt, we'll have to raise the interest rate we offer to incent them and others to buy that debt.  What do you think the debt service is on $15 trillion?  4% of $15 trillion is $600 billion, the same amount as our defense budget!  We pay interest equal to our defense budget each year to service that debt.  What happens when we have to pay 8%?  $1.2 trillion/year just to service the debt.  Where will money come from for govt pensions, social security, welfare etc.  You get the point?  
The state situations are also similar.  Right now govt pensions and wages are above or equal to the private sector.  When college graduates are wanting to go work for the govt rather than taking private sector jobs, your economy is gone. There is no more democracy or capitalisim.  This is where we've gotten too.  The solution is very painful and involves govt employee cuts to employement, wages and benefits and also tax increases for everybody.  There is no other way out of it.  
 
It's not a question of unfair trade with the Chinese, that's just a diversion and people saying that (union presidents and politicians) don't understand the history of economics.  Let me tell you the story.  After WWII our economy was very good and the US was the world's manufacturer.  Why?  Do you think it had to with American ingenuity?  Hardly, it had to do with fact Europe was bombed to smithereens as was Japan and Asia was still in the dark ages.  That's why GM grew revenues and market share, not because they had superior product, it was simply because nobody else could build anything.  Then came the 60's and 70's and Germany and Japan rebuilt themselves and started creating things at the low end of the innovation scale.  The low end of manufuacturing moved to Japan then due to labor costs (which is the largest cost in any manufacturing) and in the 70's Japan made things cheaply and the stories of China today we heard about Japan then.  Japan and Germany also began to do more than copy, they also began to innovate.  In the 80's, Japan started out-sourcing to the Tiger countries (HKong, Singapore, S. Korea) for cheaper manufacturing and they moved up the food chain in innovation. This is where Toyota, Sony, Honda grew.  In the mean-time the US was still a creditor nation because we still exported more than we imported, but the gap was closing as the world became competitive, as the world rebuilt themselves after WWII. 
 
Then came the 90's and the tigers shifted manufacturing to China, Indonesia, Phillipines and Vietnam where labor costs were cheaper.  S. Korea's chaebols and Samsung grew then and the tigers realized they could innovate too and stopped copying and started designing.  In the US, this is where our imports crossed our exports and we started to become a debtor nation.  A partial cause of this is because the US. consumer are the most materilistic people on earth and we kept buying stuff feeding demand and when you go into a store and see a US made TV for $1000 in 1992 and a Japanese designed, Korean built TV just as good for $500, which are you going to buy?  So to continue, the new century came (2000's) and all the Asian tigers and Japan were now having everything built in China due to cost.  But since China has so many people, the manufacturing keeps moving inland so it'll take 20 more years before the Chinese start moving manufacturing to latin american and africa.  They're building ties with these countries now by the way. 
 
So every decade from the 60's to now moved manufacturing to the lowest cost provider WORLDWIDE.  This is not a US phenomena, all companies every where do it.  Countries like Germany and Japan do it to. BUT they still are exporters not importers like the US, why do you think that is?  Because the German and Japanese people are FRUGAL that's why.  I lived there I know.  They just will not run out and buy the latest and greatest TV, iPhone, clothes, car etc.  This is how they maintain their competitiveness on a global scale.  They innovate and design and don't buy and turn the lights out when they walk out of a room.  The freakin German's don't even shower every day!  The save every penny they make.  Our cultural difference is why we run a trade deficit and these two modern countries run a trade surplus.  But, they both outsource manufacturing to China too in a big, big way.  
 
So there you have it with many runon sentences, but the problems in the US today have very little to do with Chinese labor rates and their cheap Yuan.  By the way, no country on earth has ever devalued their currency into prosperity, the Chinese know this and is why they continue to let their Yuan rise.  It's rising for sure, I keep track of exchange rates just not at the rate US politicians want it to.  Again, they think that if the Yuan rises, we'll somehow fix our export/import problem.  It won't, that's naive.  You can let your currency devalue like the dollar is now, for a little while and boost exports but you cannot do it in perpetuity for then confidence in the dollar will fall, nobody will buy it and US debt (resulting in loss of reserve currency status, high interest rates to incite borrowers of US debt and high debt service and default) and you'll create runaway inflation at home.  So by 2020-2025, Chinese GDP will equal the US.  The US is like Great Britain in 1900.  They were the world power and economic power (2 different things).  But by after WWI, the UK lost that status.  By 2030, the US will be a has-been nation and frankly, there's not stopping it, because of people's reaction like what's going in in Wisconsin right now.  The govt workers, just really do not understand the greater pickle were in.  Nor do the policitians.
 
I hope this clarifies some of the confusion.  You will not get the true story listening to union leaders and watching CNN or NBC.  Start reading Barrons, the Economist and the WSJ every day for the next 6 months to get the real picture, for union leaders and politicians just don't know exactly what it is.